|
|
Post by PoorHomey on Aug 2, 2011 18:41:22 GMT -5
Above SMA(20) - 63/500 Above SMA(50) - 134/500 Above SMA(200) - 243/500 Make that: Above SMA(20) - 26/500 Above SMA(50) - 71/500 Above SMA(200) - 195/500    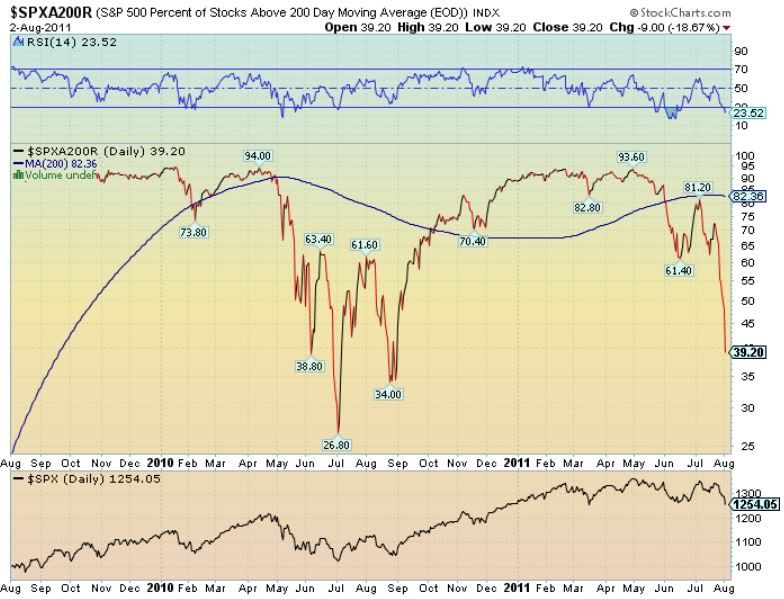 |
|
|
|
Post by PoorHomey on Aug 4, 2011 17:39:18 GMT -5
Above SMA(20) - 63/500 Above SMA(50) - 134/500 Above SMA(200) - 243/500 Make that: Above SMA(20) - 26/500 Above SMA(50) - 71/500 Above SMA(200) - 195/500 One day later...  Above SMA(20) - 4/500 Above SMA(50) - 20/500 Above SMA(200) - 110/500 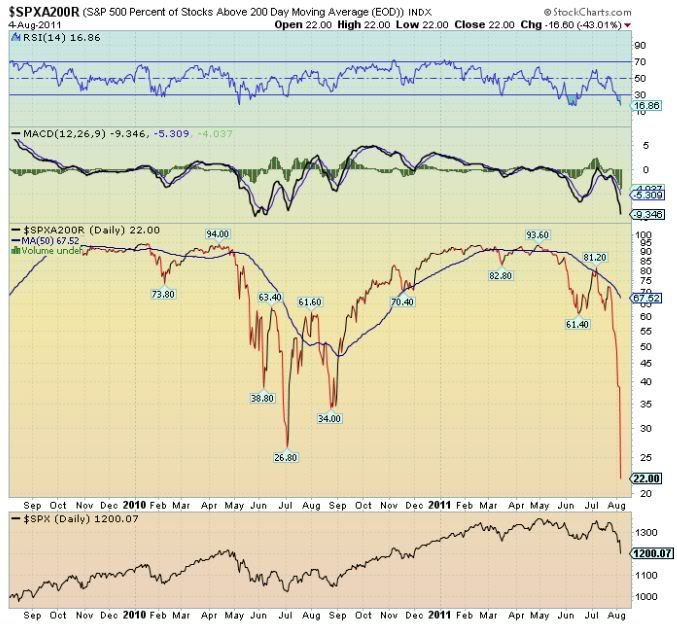 Looking a bit longer-term, this is the lowest since about May 2009  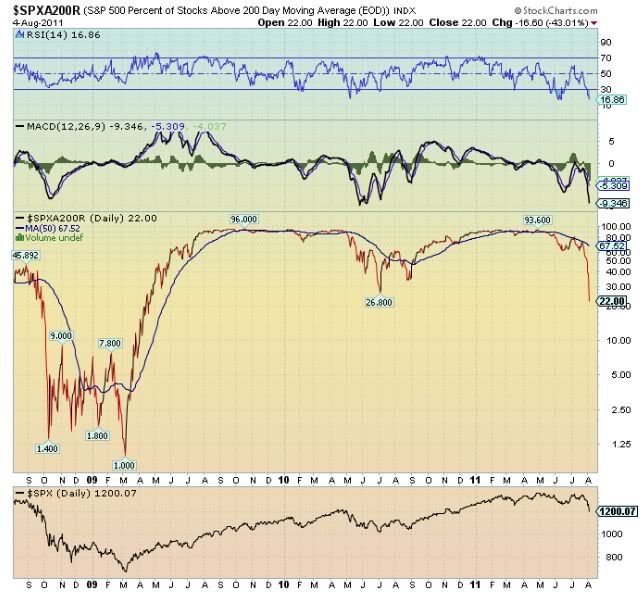 |
|
|
|
Post by brosin on Aug 4, 2011 23:26:21 GMT -5
|
|
|
|
Post by elle on Aug 7, 2011 2:03:18 GMT -5
|
|
|
|
Post by PoorHomey on Aug 8, 2011 19:03:01 GMT -5
Above SMA(20) - 63/500 Above SMA(50) - 134/500 Above SMA(200) - 243/500 Make that: Above SMA(20) - 26/500 Above SMA(50) - 71/500 Above SMA(200) - 195/500 One day later... Above SMA(20) - 4/500 Above SMA(50) - 20/500 Above SMA(200) - 110/500 Quick, somebody call an ambulance - the patient is flatlining! Maybe it needs to chew on some Spytoids - the curiously strong breadth mints???  Above SMA(20) - 0/500 Above SMA(50) - 2/500 Above SMA(200) - 43/500 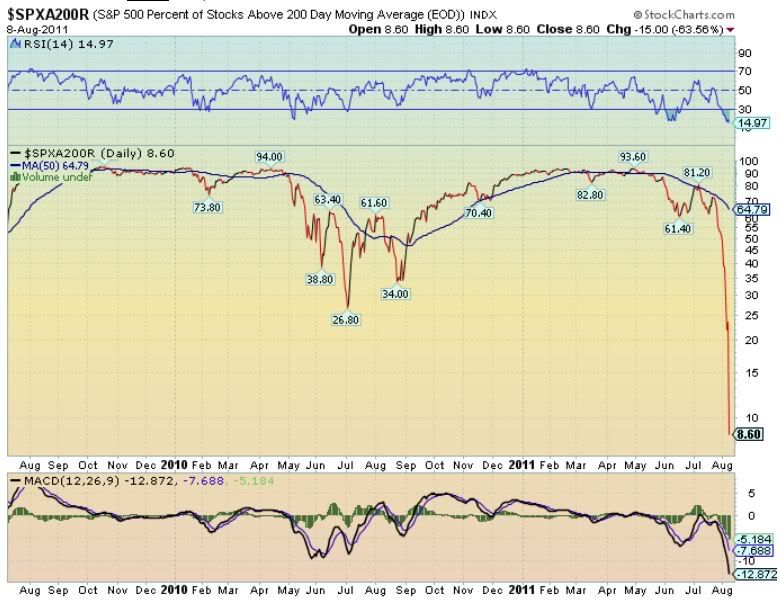 |
|
|
|
Post by brosin on Aug 10, 2011 21:04:39 GMT -5
|
|
|
|
Post by Rich on Aug 10, 2011 21:12:29 GMT -5
can't help but notice the macd was lower in last years crash and burn.
|
|
|
|
Post by maxi on Aug 10, 2011 21:14:48 GMT -5
can't help but notice the macd was lower in last years crash and burn. Meaning we have further to go? Or it isn't as bad? |
|
|
|
Post by Rich on Aug 10, 2011 21:28:56 GMT -5
can't help but notice the macd was lower in last years crash and burn. Meaning we have further to go? Or it isn't as bad? Judging from the chart itself, it looks like the move will exhaust itself in the next few weeks. But yes, the macd has historically fallen more before ('08 and '10) |
|
|
|
Post by brosin on Aug 11, 2011 16:17:10 GMT -5
somehow breadth deteriorated today  not sure how that's mathematically possible  |
|
|
|
Post by brosin on Aug 21, 2011 21:44:11 GMT -5
|
|
|
|
Post by brosin on Aug 21, 2011 21:45:02 GMT -5
|
|
|
|
Post by Rich on Aug 25, 2011 16:15:13 GMT -5
Continuation Triangle Signs of a wary market Ben better say something good  Uploaded with ImageShack.usgdp 2nd quarter estimate tomorrow along with Michigan consumer sentiment. |
|
|
|
Post by mrgrape on Aug 31, 2011 1:20:27 GMT -5
Continuation Triangle Signs of a wary market Ben better say something good Uploaded with ImageShack.usgdp 2nd quarter estimate tomorrow along with Michigan consumer sentiment. I think bear flag instead ;D |
|
|
|
Post by brosin on Sept 15, 2011 20:30:02 GMT -5
|
|
|
|
Post by brosin on Sept 16, 2011 20:58:27 GMT -5
breadth had a good day and a good week It's trying to go all V bottom on us  |
|
|
|
Post by brosin on Sept 16, 2011 21:04:43 GMT -5
nasdaq is steaming, wow  |
|
|
|
Post by brosin on Sept 28, 2011 22:07:02 GMT -5
double bottom on copper?  |
|
|
|
Post by cosmic on Sept 29, 2011 16:06:39 GMT -5
I should think by now $NYSI looks similar to it's other bottom patterns?
|
|
|
|
Post by brosin on Sept 29, 2011 18:26:50 GMT -5
|
|
|
|
Post by jack on Sept 29, 2011 18:34:57 GMT -5
Okay...I'll play along So Bros - what's that supposed to be telling us? That its oversold on the RSI and that the MACD's about to go positive so BUY the crap out of the sucker??? Is that what yer trying to tell us? I wish all those who put up charts would provide the explanation (ya know like: "This shows that....blah blah blah") but thanks anyway. |
|
|
|
Post by brosin on Sept 29, 2011 18:54:24 GMT -5
I put it up because Cos asked about it - don't really have any thoughts on it currently or what it's really showing other than the basic notion that breadth is substantially off the bottom and at a key level as to where we're headed next. It -- like the market -- seems torn.
|
|
|
|
Post by jack on Sept 29, 2011 19:04:09 GMT -5
I put it up because Cos asked about it - don't really have any thoughts on it currently or what it's really showing other than the basic notion that breadth is substantially off the bottom and at a key level as to where we're headed next. It -- like the market -- seems torn. Thanks |
|
|
|
Post by elle on Oct 13, 2011 0:33:36 GMT -5
daily fork+ IWM, still a long way to go if hold S, but also that bottom line is long way down.  Uploaded with ImageShack.us |
|
|
|
Post by brosin on Oct 14, 2011 13:26:03 GMT -5
|
|
|
|
Post by brosin on Oct 20, 2011 0:10:56 GMT -5
Not looking good according to Dr Copper Needs a bounce around here  |
|
|
|
Post by brosin on Oct 21, 2011 13:23:50 GMT -5
Very strong bounce for copper since yesterday. Weekly chart looks pretty strong after that retest (assuming of course that it holds into next week after opex is done)  |
|
|
|
Post by brosin on Nov 30, 2011 21:41:25 GMT -5
Almost appears as if bears have started retaking control only recently. And that is one steep up climb that we are retracing. Won't be easy to turn that around unless we get some more days like today and hold them  |
|


 not sure how that's mathematically possible


