

Post by brosin on Sept 15, 2010 23:51:16 GMT -5
courtesy of Brian Shannon's Alphatrends

Caldaro: Overnight the Asian markets were mostly higher. Europe opened lower, however, and closed -0.20%. US index futures were lower overnight, and before the open there was a flurry of economic reports. The NY FED reported continued softening in activity but still positive: +4.1 v +7.1. Import prices (+0.3% v -0.3%) and Export prices (+0.5% v -0.2%) turned positive. Also Industrial production remained positive (+0.2% v +1.0%), and Capacity utilization was flat (74.7% v 74.8%). At the open the market gapped down to SPX 1115 within the first few minutes. That was the low for the day. After about 15 minutes the market started to rally. For the rest of the day the market inched its way up, with only small pullbacks along the way, to SPX 1126 by around 3:30. Then it dipped a bit to close at SPX 1125.
For the day the SPX/DOW were +0.40%, and the NDX/NAZ were +0.55%. Bonds lost 9 ticks, Crude slid $1.05, Gold slipped $3.00, and the USD was higher. Support for the SPX remains at 1107 and then 1090, with resistance at 1136 and then 1146. Short term momentum dipped below neutral at the open to a similar level the day after Labor day, then started to rise. Tomorrow, weekly Jobless claims at 8:30, along with the PPI and the Current accounts deficit. Then at 10:00 the Philly FED.
Today's opening gave us a better view of how this rally has unfolded since the SPX 1041 low on August 31st. We have labeled the SPX hourly chart (link below) as Minute wave one at SPX 1105, Minute wave ii at SPX 1091, Minute wave iii at SPX 1127 and Minute wave iv at SPX 1115 this morning. This suggests the market should make another high, at or above SPX 1127, to complete five Minute waves up from that 1041 low. These five waves should only complete Minor wave 1 of Intermediate wave three for this uptrend. Review Intermediate wave one on the hourly chart to get an idea of how the waves of this type of structure unfold. After this new high is hit we may get the largest pullback since this rally began. Thus far the largest pullback has only been 14 points. With the SPX now in the 1120's the OEW pivot at 1090 again becomes the major focus for any pullbacks during the uptrend.
Medium term we are seeing pockets of relative strength in recent days. Five of the nine SPX sectors have made new highs for the uptrend, as have seven of the thirteen Foreign indices we follow. The NYAD (market breadth) has been making new highs, the VIX (volatility) is making new downtrend lows, economically sensitive stocks/commodities are improving, plus the SOX made a new short term high and the KBE needs to get over 24 to do the same. Best to your trading!
Cobra: The bottom line, the short-term trend is up and I hold partial long overnight, not sure if it’s safe though.
The most noticeable thing today is both VIX and SPX closed in green. As I bet still many people are interested to know what happens next, so I posted the chart below even it just means a tiny tiny little bit bearish toward tomorrow. My advice to you is still don’t get too bullish. Feel like a decisive bullish day today? Well, not so fast, take a look at NYAD below, it’s just a tiny up day and it fits well with what I’ve been describing: a small up or consolidation for a few days before a real pullback, unless a huge up day kicks in. Well, at least today is not an huge up day, isn’t it?
Nothing to say today, maintain the forecast mentioned in 09/13 Market Recap: Expect a pullback, but it may occur after a few days small up or consolidation.
From the chart below, a consolidation under an important resistance (red horizontal line) usually has a little better chance to breakout on the upside especially now it could simply gap above the resistance tomorrow morning without any serious fight. Yet, still, unless we see a huge up, I mean really huge, otherwise the negative divergence shown on chart would become much larger that eventually it has to be corrected via a little bigger pullback, if indeed SPY breakout on the upside tomorrow. Besides, don’t forget, if SPY gaps up tomorrow morning unfilled, then it’d be the 18th SPY unfilled gaps which tied the historical record.
Bespoke:
Just When You Thought It Was Safe to Start Shorting Again...
Even though the S&P 500 dropped by more than 10% from its April peak through August, short interest levels remained flat for much of the Summer, and for several indices it actually declined. Then August came, and stocks saw their largest declines for that month since 2001 on fears that a double dip was increasingly likely. With negative sentiment rising rapidly, and the historically bad month of September ahead, short sellers came out of the woodwork. In the second half of August, the average short interest as a percentage of float for S&P 1500 stocks rose to a 52-week high of 6.9%.
So how have the bears fared since turning more aggressive? Not well. While September is normally the cruelest month, this year September is off to its best start in over seventy years. They say timing is everything, and for those who stepped up their short bets towards the end of August, the timing couldn't have been worse.
Volumes Down at the Real Casinos Too
Now more than at any other point in a generation, individual investors have the feeling that like a casino, the equity market is stacked against them, especially after the 'flash crash' in May. In fact, this is one of the most often cited reasons for the dwindling volumes in the equity market. With finances being tight, coupled with the feeling that they just can't win, individual investors are giving up. With that thought in mind, we looked to see how volumes at the real casinos are doing.
In the charts below, we highlight the monthly revenues of Nevada casinos going back to 2004. Like the equity market, revenues at the casinos peaked in 2007. Unlike the stock market, however, casino revenues are still trending lower and have yet to show any meaningful rebound. The second chart below shows the year/year percent change in Nevada gaming revenues since 2005 with the month of July highlighted in red. As shown, revenues have declined by more than 10% for each of the last three Julys.
Much of the decline in casino revenues is undoubtedly due to the fact that the economy fell off a cliff in 2007. The only question going forward is when the economy rebounds and Americans are feeling a little richer, which casino will they head back to? The stock market or Vegas?
Another Up Day For the S&P 500
If it's September it must be another up day for stocks. With a gain of 0.35% today, the S&P 500 has now traded higher in eight of the last ten trading days and is up over 7% this month! With the rally, the index has now closed above its 200-day moving average for the third day in a row, and is now setting its sights on the 1,130 level which represents the August highs.
Ritholtz:
1990 Newsweek Cover: The Real Estate BUST
As a follow up to yesterday’s look at Time magazine’s Housing covers, Paul Macrae Montgomery of Universal Economics was kind enough to share this report from 1992.
In that research piece, Paul had made mention of an October 1st, 1990 cover story in Newsweek: The Real Estate BUST.

How well did that cover work out ?
Pretty well indeed . . .
Caldaro: Overnight the Asian markets were mostly higher. Europe opened lower, however, and closed -0.20%. US index futures were lower overnight, and before the open there was a flurry of economic reports. The NY FED reported continued softening in activity but still positive: +4.1 v +7.1. Import prices (+0.3% v -0.3%) and Export prices (+0.5% v -0.2%) turned positive. Also Industrial production remained positive (+0.2% v +1.0%), and Capacity utilization was flat (74.7% v 74.8%). At the open the market gapped down to SPX 1115 within the first few minutes. That was the low for the day. After about 15 minutes the market started to rally. For the rest of the day the market inched its way up, with only small pullbacks along the way, to SPX 1126 by around 3:30. Then it dipped a bit to close at SPX 1125.
For the day the SPX/DOW were +0.40%, and the NDX/NAZ were +0.55%. Bonds lost 9 ticks, Crude slid $1.05, Gold slipped $3.00, and the USD was higher. Support for the SPX remains at 1107 and then 1090, with resistance at 1136 and then 1146. Short term momentum dipped below neutral at the open to a similar level the day after Labor day, then started to rise. Tomorrow, weekly Jobless claims at 8:30, along with the PPI and the Current accounts deficit. Then at 10:00 the Philly FED.
Today's opening gave us a better view of how this rally has unfolded since the SPX 1041 low on August 31st. We have labeled the SPX hourly chart (link below) as Minute wave one at SPX 1105, Minute wave ii at SPX 1091, Minute wave iii at SPX 1127 and Minute wave iv at SPX 1115 this morning. This suggests the market should make another high, at or above SPX 1127, to complete five Minute waves up from that 1041 low. These five waves should only complete Minor wave 1 of Intermediate wave three for this uptrend. Review Intermediate wave one on the hourly chart to get an idea of how the waves of this type of structure unfold. After this new high is hit we may get the largest pullback since this rally began. Thus far the largest pullback has only been 14 points. With the SPX now in the 1120's the OEW pivot at 1090 again becomes the major focus for any pullbacks during the uptrend.
Medium term we are seeing pockets of relative strength in recent days. Five of the nine SPX sectors have made new highs for the uptrend, as have seven of the thirteen Foreign indices we follow. The NYAD (market breadth) has been making new highs, the VIX (volatility) is making new downtrend lows, economically sensitive stocks/commodities are improving, plus the SOX made a new short term high and the KBE needs to get over 24 to do the same. Best to your trading!
Cobra: The bottom line, the short-term trend is up and I hold partial long overnight, not sure if it’s safe though.
The most noticeable thing today is both VIX and SPX closed in green. As I bet still many people are interested to know what happens next, so I posted the chart below even it just means a tiny tiny little bit bearish toward tomorrow. My advice to you is still don’t get too bullish. Feel like a decisive bullish day today? Well, not so fast, take a look at NYAD below, it’s just a tiny up day and it fits well with what I’ve been describing: a small up or consolidation for a few days before a real pullback, unless a huge up day kicks in. Well, at least today is not an huge up day, isn’t it?
Nothing to say today, maintain the forecast mentioned in 09/13 Market Recap: Expect a pullback, but it may occur after a few days small up or consolidation.
From the chart below, a consolidation under an important resistance (red horizontal line) usually has a little better chance to breakout on the upside especially now it could simply gap above the resistance tomorrow morning without any serious fight. Yet, still, unless we see a huge up, I mean really huge, otherwise the negative divergence shown on chart would become much larger that eventually it has to be corrected via a little bigger pullback, if indeed SPY breakout on the upside tomorrow. Besides, don’t forget, if SPY gaps up tomorrow morning unfilled, then it’d be the 18th SPY unfilled gaps which tied the historical record.
Bespoke:
Just When You Thought It Was Safe to Start Shorting Again...
Even though the S&P 500 dropped by more than 10% from its April peak through August, short interest levels remained flat for much of the Summer, and for several indices it actually declined. Then August came, and stocks saw their largest declines for that month since 2001 on fears that a double dip was increasingly likely. With negative sentiment rising rapidly, and the historically bad month of September ahead, short sellers came out of the woodwork. In the second half of August, the average short interest as a percentage of float for S&P 1500 stocks rose to a 52-week high of 6.9%.
So how have the bears fared since turning more aggressive? Not well. While September is normally the cruelest month, this year September is off to its best start in over seventy years. They say timing is everything, and for those who stepped up their short bets towards the end of August, the timing couldn't have been worse.
Volumes Down at the Real Casinos Too
Now more than at any other point in a generation, individual investors have the feeling that like a casino, the equity market is stacked against them, especially after the 'flash crash' in May. In fact, this is one of the most often cited reasons for the dwindling volumes in the equity market. With finances being tight, coupled with the feeling that they just can't win, individual investors are giving up. With that thought in mind, we looked to see how volumes at the real casinos are doing.
In the charts below, we highlight the monthly revenues of Nevada casinos going back to 2004. Like the equity market, revenues at the casinos peaked in 2007. Unlike the stock market, however, casino revenues are still trending lower and have yet to show any meaningful rebound. The second chart below shows the year/year percent change in Nevada gaming revenues since 2005 with the month of July highlighted in red. As shown, revenues have declined by more than 10% for each of the last three Julys.
Much of the decline in casino revenues is undoubtedly due to the fact that the economy fell off a cliff in 2007. The only question going forward is when the economy rebounds and Americans are feeling a little richer, which casino will they head back to? The stock market or Vegas?
Another Up Day For the S&P 500
If it's September it must be another up day for stocks. With a gain of 0.35% today, the S&P 500 has now traded higher in eight of the last ten trading days and is up over 7% this month! With the rally, the index has now closed above its 200-day moving average for the third day in a row, and is now setting its sights on the 1,130 level which represents the August highs.
Ritholtz:
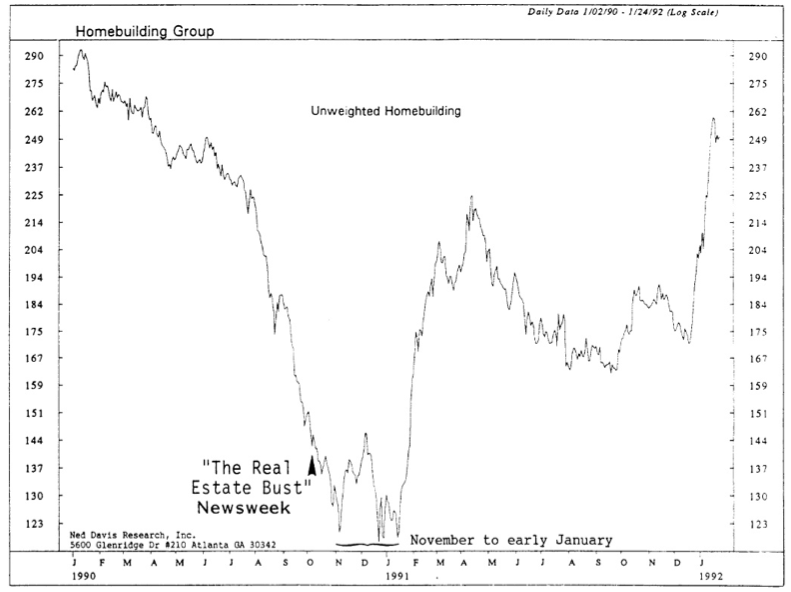
1990 Newsweek Cover: The Real Estate BUST
As a follow up to yesterday’s look at Time magazine’s Housing covers, Paul Macrae Montgomery of Universal Economics was kind enough to share this report from 1992.
In that research piece, Paul had made mention of an October 1st, 1990 cover story in Newsweek: The Real Estate BUST.
How well did that cover work out ?
Pretty well indeed . . .


